Non-Gaming Apps Just Hit a Tipping Point. Here’s What it Means for Retail Apps
For the first time in mobile history, consumers spent more money in non-gaming apps than in games during 2025. Non-gaming in-app purchases reached $85.6 billion, representing a 21% year-over-year increase and 2.8 times the amount spent just five years earlier. Gaming apps generated $81.8 billion with only 1% growth, signaling a fundamental shift in how consumers shop on mobile devices.1
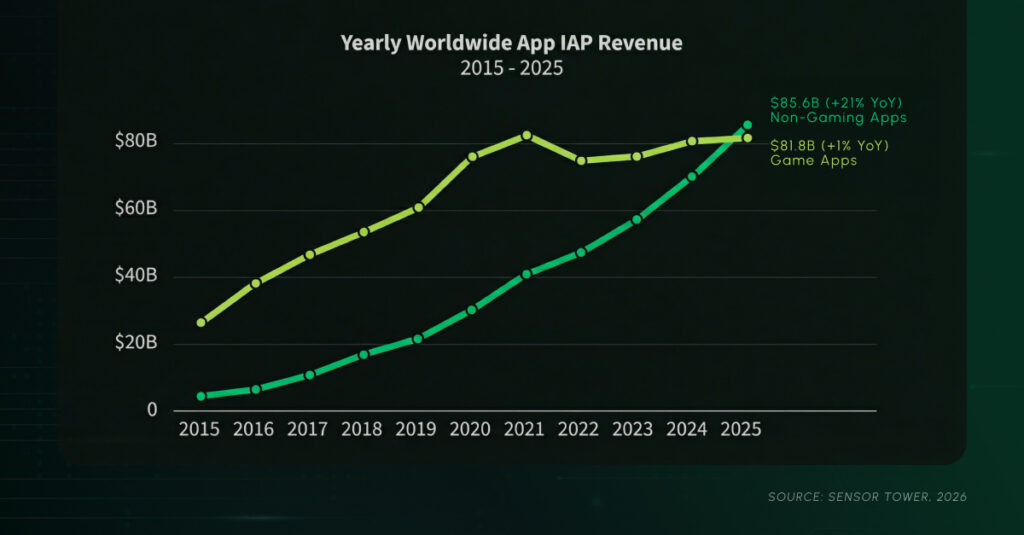
Source: Sensor Tower 1
Your Customers Are Already Mobile-First. Is Your Strategy?
Mobile commerce now represents 59% of global retail e-commerce sales, totaling $4.01 trillion in 2025.2 This figure is beyond earlier projections that estimated mobile commerce would reach $3.35 trillion by 2028.3 In the United States, mobile retail e-commerce sales hit $710 billion in 2025.2
Source: EMARKETER 4
If you’re a retail brand, the majority of your customer interactions are happening on mobile devices right now. The question isn’t whether to invest in mobile. The question is whether you’re investing in the right mobile strategies to actually convert that engagement into revenue.
Mobile Engagement By the Numbers
Your customers are on their mobile devices. Here’s exactly how much:
- Consumers spend an average of 3.6 hours per day in mobile apps.1
- Users engage with 34 different apps per month.1
- Consumers spend $318,000 per minute across all mobile apps.1
- Shopping apps generated over 41.9 billion hours of engagement in 2024, up 7.44% year-over-year.3
The data gets even more interesting when you compare mobile app engagement to mobile web:1
- 85% of U.S. mobile shoppers prefer using apps over mobile websites.3
- 70% to 73% of online shoppers globally prefer mobile apps to mobile sites.2
- Mobile apps deliver twice the conversion rate of mobile web environments.2
- Average order values tend to be higher in apps thanks to seamless user experience and personalization capabilities.2
The Mobile Performance Gaps Retailers Must Close
What we’ve learned so far: mobile commerce owns 59% of global retail sales. So how are retailers with mobile apps optimizing?
Here are three fixable mobile performance pitfalls that could help retail apps close the gap on billions of lost conversions.
1. Fix Cart Abandonment to Recover Billions in Lost Revenue
Right now, 85.65% of shoppers who add items to their mobile cart leave without buying.2 That means you’re losing 85 out of every 100 potential customers at the finish line. Even just closing the gap between desktop (69.32%) and mobile (85.65%) cart abandonment could mean the difference of billions of recoverable revenue.
What the data shows:
- Mobile cart abandonment: 85.65%.2
- Desktop cart abandonment: 69.32%.2
- Average global e-commerce cart abandonment across all devices: 70.22%.5
- Mobile checkout abandonment: 84.8%.3
- 48% of shoppers abandon because of unexpected costs.2
How to fix it:
- Eliminate surprise costs at checkout by displaying total price (including shipping and taxes) earlier in the shopping journey
- Implement in-app push notifications to recover carts within 48 hours (when conversion rates are 3x higher)
- Streamline checkout to 60 seconds or less with one-click payment options
- Offer flexible payment options including buy now, pay later to reduce sticker shock
- Use dynamic retargeting to show exact cart contents with urgency messaging tied to inventory or deadlines
2. Optimize Mobile Conversion Rates to Match Desktop Performance
Mobile generates the majority of traffic yet converts at 2.85%, while desktop converts at 3.9%.2 This gap means you’re paying to acquire mobile traffic that underperforms compared to desktop visitors. The good news? Mobile apps convert at twice the rate of mobile web, proving the conversion gap is fixable with the right approach.
What the data shows:
- Mobile conversion rate: 2.85%2
- Desktop conversion rate: 3.9%2
- Mobile apps deliver 2x the conversion rate of mobile web.2
- Mobile conversion rates have improved 30% over the past two years due to better UX and payment flows.2
How to fix it:
- Prioritize app-based shopping experiences over mobile web (apps convert at 2x the rate)
- Reduce friction at every step: minimize form fields, enable autofill, and offer guest checkout
- Highlight mobile wallet options (Apple Pay, Google Pay) prominently at checkout to reduce payment friction
- Implement A/B testing on checkout flows to identify and eliminate conversion bottlenecks
- Use session replay tools to identify where mobile users drop off and redesign those touchpoints
3. Invest in Mobile UX to Unlock 400% Conversion Upside
Your mobile app might be losing a third of your revenue before customers even reach checkout. The culprit? User experience design that creates friction like slow load times, clunky navigation, and complicated checkout flows. Fixing your UX can deliver measurable results: retailers who invest in mobile UX see conversion rates jump as much as 400%.2
What the data shows:
- 88% of mobile e-commerce apps score “mediocre” or worse on UX.2
- Poor mobile UX leads to a 35% average loss in sales.2
- 57% of users will avoid recommending sites with poor mobile UX.2
- Strong mobile UX can boost e-commerce conversion rates by up to 400%.2
- If a mobile page takes more than 3 seconds to load, 53% of visitors leave before engaging.2
How to fix it:
- Conduct mobile UX audits to identify pages with load times exceeding 3 seconds
- Optimize image sizes and implement lazy loading to improve page speed
- Simplify navigation with thumb-friendly tap targets and clear category hierarchies
- Test checkout flows on actual devices (not just emulators) to catch friction points
- Implement progressive web app features (offline browsing, add-to-home-screen prompts) if a native app isn’t feasible
- Use heat mapping and session recording to identify where users struggle and redesign accordingly
Time to Close the Mobile Commerce Gap
Mobile commerce represents 59% of global retail sales and $4.01 trillion in annual revenue. The infrastructure is built and the customers are engaged. What separates winning brands from the rest is execution: recovering abandoned carts faster, converting mobile traffic at desktop-level rates, and delivering experiences that keep customers coming back.
Key Takeaways
Mobile commerce has fundamentally shifted: Non-gaming app revenue ($85.6B) surpassed gaming revenue ($81.8B) for the first time in 2025, proving mobile is now the primary channel for consumer transactions across all categories.
The engagement advantage is undeniable: With consumers spending 3.6 hours per day in apps and mobile apps converting at 2x the rate of mobile web, app-based strategies deliver measurably superior performance.
Three fixable gaps are costing billions: Cart abandonment (85.65% on mobile vs 69.32% on desktop), conversion rate gaps (2.85% mobile vs 3.9% desktop), and poor mobile UX (88% of apps score “mediocre” or worse) represent the largest opportunities for improvement.
Apps outperform mobile web by every metric: 85% of U.S. shoppers prefer apps, apps deliver 2x conversion rates, and average order values run higher in app environments thanks to personalization and seamless checkout.
The winners will be mobile-first by design: Retailers that prioritize app experiences, implement real-time cart recovery, optimize for mobile wallets, and invest in world-class mobile UX will capture disproportionate market share as mobile commerce continues its accelerated growth trajectory.
Turn Mobile Traffic Into Revenue
Aarki powers performance for e-commerce and gaming brands through proprietary neural architecture that optimizes across user acquisition, retargeting, CTV, and influencer campaigns as one connected growth engine. Our machine learning platform identifies high-value users, predicts conversion probability and lifetime value at impression, and delivers the real-time optimization that turns mobile traffic into measurable revenue.
Ready to close the mobile performance gap? Contact Aarki to learn how our platform can help you recover abandoned carts, boost mobile conversion rates, and scale profitable customer acquisition across channels.
References
- Sensor Tower: State of Mobile 2026, 2026
- SQ Magazine: Mobile eCommerce Statistics 2026: Surging App Sales, UX Trends & Wallet Adoption, 2025
- Capital One Shopping: Mobile eCommerce Statistics, 2025
- EMARKETER: Retail Mobile App Shopping 2026, 2026
- Baymard Institute: Cart Abandonment Rate Statistics, 2025